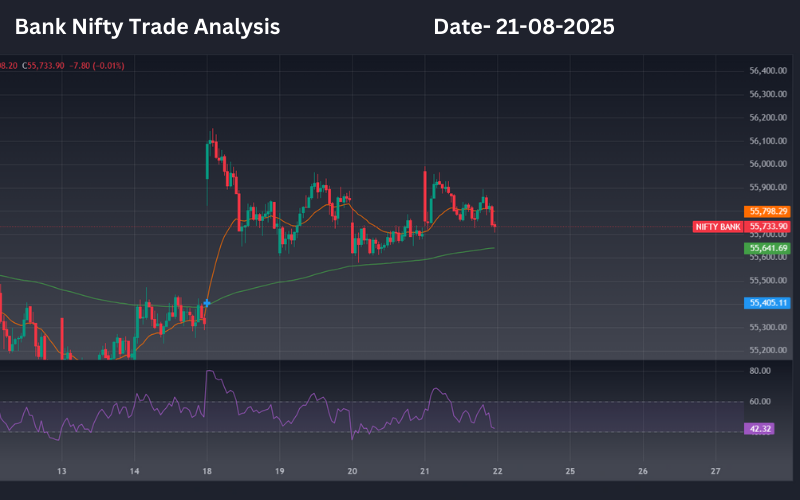
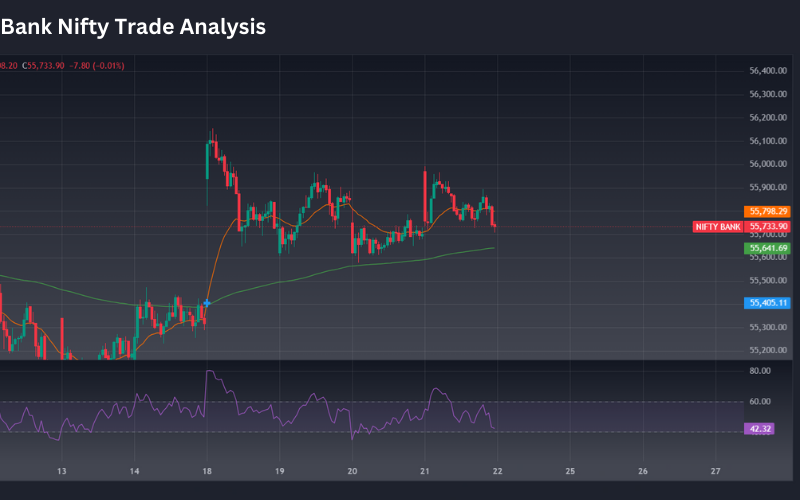
EMA Cross: The orange (short-term) EMA is currently below the green (long-term) EMA, suggesting a bearish trend in the near term.
RSI (Relative Strength Index):
RSI Value: 42.32
Interpretation: Since the RSI is below 50, it indicates that the market is currently in a bearish phase. An RSI value below 30 suggests oversold conditions, but 42 is still within a neutral to weak bearish range.
Bullish Scenario:
If the short-term EMA crosses above the long-term EMA, it would signal a bullish trend.
RSI above 50 would confirm buying strength, indicating a potential upward movement.
Traders could have entered a buy position after confirmation of the EMA crossover (when the short-term EMA crosses above the long-term EMA).
Profit Target: Look for resistance near 55,800-55,900 levels, based on previous price action and EMAs.
Bearish Scenario:
The short-term EMA remains below the long-term EMA, confirming a bearish trend.
RSI value of 42.32 supports the weakness in the trend, signaling a potential sell entry.
Traders could have entered a sell position when the EMA crossover occurred, especially when the price dipped below the 55,700 mark.
Profit Target: Bearish traders should target levels near 55,400-55,500 as the next support, considering market fluctuations.
Profit or Loss for Today’s Trade:
If entered a Sell position:
Enter around 55,700-55,800 based on EMA confirmation.
Exit around 55,400 (support zone).
Profit: About 300-400 points.
If entered a Buy position:
Enter near 55,500-55,600 (bounce from EMA support).
Exit near 55,800-55,900 (resistance level).
Profit: Potential for 200-300 points.
Trade Recommendation Based on Today’s Chart:
Since the short-term EMA is below the long-term EMA, bearish conditions seem to dominate.
A sell trade would be preferred today, with a stop-loss above 55,800 and targeting the support level near 55,400.